Measures of central tendency
Measures of central tendency are so called because they describe “where”, in the set of the data collected, values are concentrated. Mean The mean is the average score in a data set. It is computed by summing all the scores and dividing by the sample size (or number of scores). The mean is very useful when it is necessary to summarise all the data collected using a single value. However, it should be remembered that it is influenced by all values, including extreme ones, i.e. the highest and the lowest value collected (Lehner, 1996). Example. The amount of time that a herd of 10 horses spend grazing per day has been measured for each individual. The following data have been collected.
The mean time spent grazing in this heard of horses is 9.8 hours. This result is obtained from the sum total of time per animal (10+9+10.5+9.5+8.5+10+11+9.5+10+10) divided by the total of animals (98/10). Mode The mode is the most commonly occurring value or category in a series of values. It is more evident with a large sample size (Lehner, 1996; Howitt and Cramer, 2007). The mode is therefore used when it is necessary to know which is the most frequently occurring event. To give an example relevant to behaviour, this may be a useful measure when we want to know how an animal generally behaves in a certain situation, e.g. what is “common behaviour”. In order to do this it is necessary to observe a group of animals of that species in that situation and then calculate the mode – in other words the most frequently occurring behaviour, which is that we want. Example 1. A population of 500 female dogs has been observed when they urinate, and the posture adopted by each individual has been recorded. The following data have been collected.
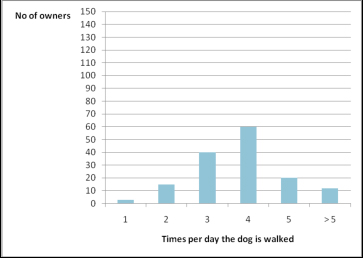
In this case the mode is the squat posture, adopted by most of the dogs in the sample. It is clear that in this case a mean value does not have a great utility. Indeed, the mean and the median would reflect just the numerical distribution of data per category (i.e. how many individuals are in each group, which merely depend on the number of animals that we decide to observe). The mode instead gives a clear idea of what posture is adopted by the larger number of individuals between the dogs observed. Example 2. We want to know how many times per day dogs are most commonly walked by their owner in our city. Therefore we interview a sample population of 150 dog owners. Data collected are summarised in the graph below: the most represented value is 4 (times per day), which is then the mode of our sample. Graphic representation of the example.
The mode of the sample is 4, as it is the value more represented in the sample (60 owners walk their dog 4 times per day). Median The median is the value with an equal number of values on either side of it when data points are ordered from the smallest to the largest (Lehner, 1996; Howitt and Cramer, 2007), e.g. the middle value. Its numerical value is influenced only by being the central value and does not directly take into account the actual numerical values of the other data points, simply their positioning from smallest to largest, e.g. their rankings. In the case of a data set with an even number of values, the median value corresponds to the mean of the central pair of values (Clarke, 1994). The median is very useful to describe the average in a set of data, when these are not symmetrically distributed (i.e. many data are near a certain value). In these cases the mean is less useful as, being influenced by extremes it would be towards the value more represented. Example 1. The number of hours spent sleeping each day is measured in a population of 15 outdoor cats. The following data have been collected and ordered from the smallest to the largest score.
As it can be seen in the table, the data collected are ordered from the smallest to the largest value. Then the median value can be found by counting which value has the same number of values on the right and on the left: the median value is 13 hours (7 values are on the right and 7 on the left) and the mean is 13.1. If number of data was even (e.g. 14 cats) the median would have been the mean value of the central couple of numbers. Example 2. Compare with previous example how one data point can change the mean substantially but not necessarily the median. The number of hours spent sleeping each day is measured in a population of 15 outdoor cats. The following data have been collected and ordered from the smallest to the largest score.
As it can be seen in the table, the data collected are ordered from the smallest to the largest value. Then the median value can be found by counting which value has the same number of values on the right and on the left: the median value is 13 hours (7 values are on the right and 7 on the left). However, the mean has changed from 13.1 in example 1 to 12.5 due to the differing data point for Animal 1. Commonly, mode and median are used with discrete data whereas mean is used for continuous data. |
|||||||||||||||||||||||||||||||||||||||||||||||||||||||||||||||||||||||||||||||||||||||||||||||||||||||

Compiled by:
Dr Sarah Ellis and Dr Helen Zulch
